Dynamic Analysis
Dynamic Analysis
Malware Analysis Sandbox:
Controlled Environment:
intentionally executing malware makes a sandboxed environment critical to prevent unintended spread or damage. Risk of accidental execution in a live environment. Sandbox: Ensures safe execution and analysis of malware without contaminating other systems.
Requirements of a Sandbox:
Isolated Machine: Use a —Virtual Machine (VM) dedicated to malware analysis. Ensure no connection to live or production systems to prevent malware spread.
Snapshot Functionality: VMs must save a clean state (initial setup) and revert to it after each analysis. Reverting prevents contamination from previous malware affecting new analyses.
Monitoring Tools: Tools to observe malware behavior during execution. Automated Tools: Built into sandboxes (e.g., Cuckoomon in Cuckoo sandbox). Manual Tools: Require analyst interaction for detailed analysis (covered later).
File-Sharing Mechanism: Safely transfer malware into the VM and extract analysis data/reports. Common methods: Shared directories or network drives. Caution: Unmount shared directories during malware execution to avoid infection (e.g., ransomware encrypting shared files).
ProcMon:
Part of Sysinternals Suite: A collection of advanced Windows utilities created by Winternals Software, acquired by Microsoft in 2006. it Monitors and analyzes system activities, widely used in security research for malware analysis. Tracks Registry, Filesystem, Network, Process/Thread, and Profiling events in real-time.
Interface and Controls:
Hovering over controls displays brief descriptions.
- Open a file with ProcMon events or save events to a supported file format.
- Removes all currently displayed events to reduce noise after executing malware.
- Customizes which events are displayed in the ProcMon window.
- Enable/disable specific event types (Registry, FileSystem, Network, Process/Thread, Profiling).
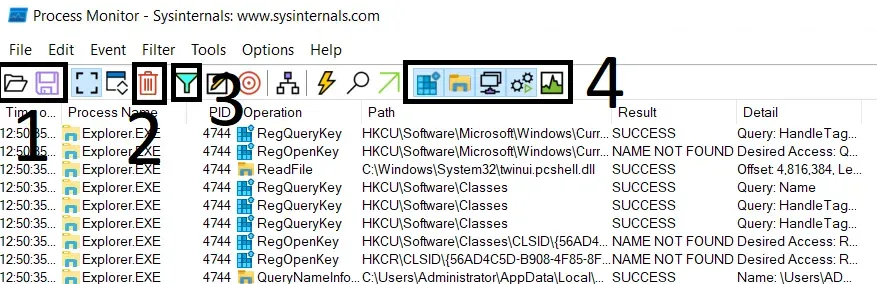
Event Display: Columns: Time, Process, Process ID (PID), Event Name, Path, Result, Details. Events listed chronologically. High volume of events requires filtering for effective analysis.
Filtering Events:
Right-click on a column (e.g., Process Name or Operation) to access filtering options.
Include: Show only events matching the selected value (e.g., Include ‘Explorer.EXE’ shows only Explorer.EXE events).
Exclude: Hide events matching the selected value (e.g., Exclude ‘Explorer.EXE’ removes Explorer.EXE events).
Advanced Filtering:
Click the Filter option in the ProcMon menu has a funnel icon.
Filter Creation: Select: Field (e.g., Process Name), Relation (e.g., is), Value (e.g., Explorer.EXE), Action (Include/Exclude). Check the box to apply the filter; uncheck to ignore.
Behavior: Include filter: Shows only events matching the specified value (e.g., only Explorer.EXE events). Exclude filter: Hides events matching the specified value (e.g., no Procmon.exe events).
Process Tree:
Displays all processes in a parent-child hierarchy. Access: Click the Process Tree icon in the ProcMon menu. Helps identify relationships between processes (e.g., parent process spawning child processes during malware execution). Shows a tree structure of processes, useful for tracking malware’s process interactions.
API Logger:
Monitors and logs API calls made by a process to understand malware behavior. Simple tool providing basic information about API calls.
Interface and Usage:
Interface includes:
Upper Pane: Displays running processes and their Process IDs (PIDs).
Lower Pane: Shows the log of API calls for the monitored process.
Monitoring a New Process: Click the three-dot menu to open a file browser. Select the executable file to monitor. Click Inject & Log to start logging API calls.
Output: Lower pane displays API calls with details (e.g., PID, API name, and basic info in the ‘msg’ field).
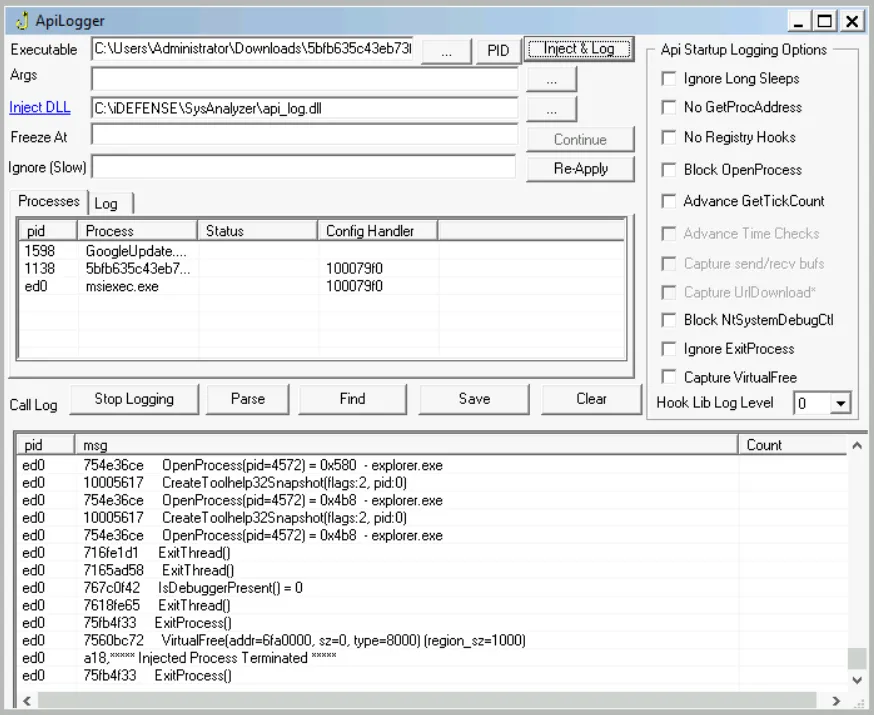
Monitoring a Running Process: Click the PID menu to view a list of running processes. Window displays: Process Name, PID, User running the process, and Image Path. Select a process to monitor and proceed with logging (same as new process).
API Monitor:
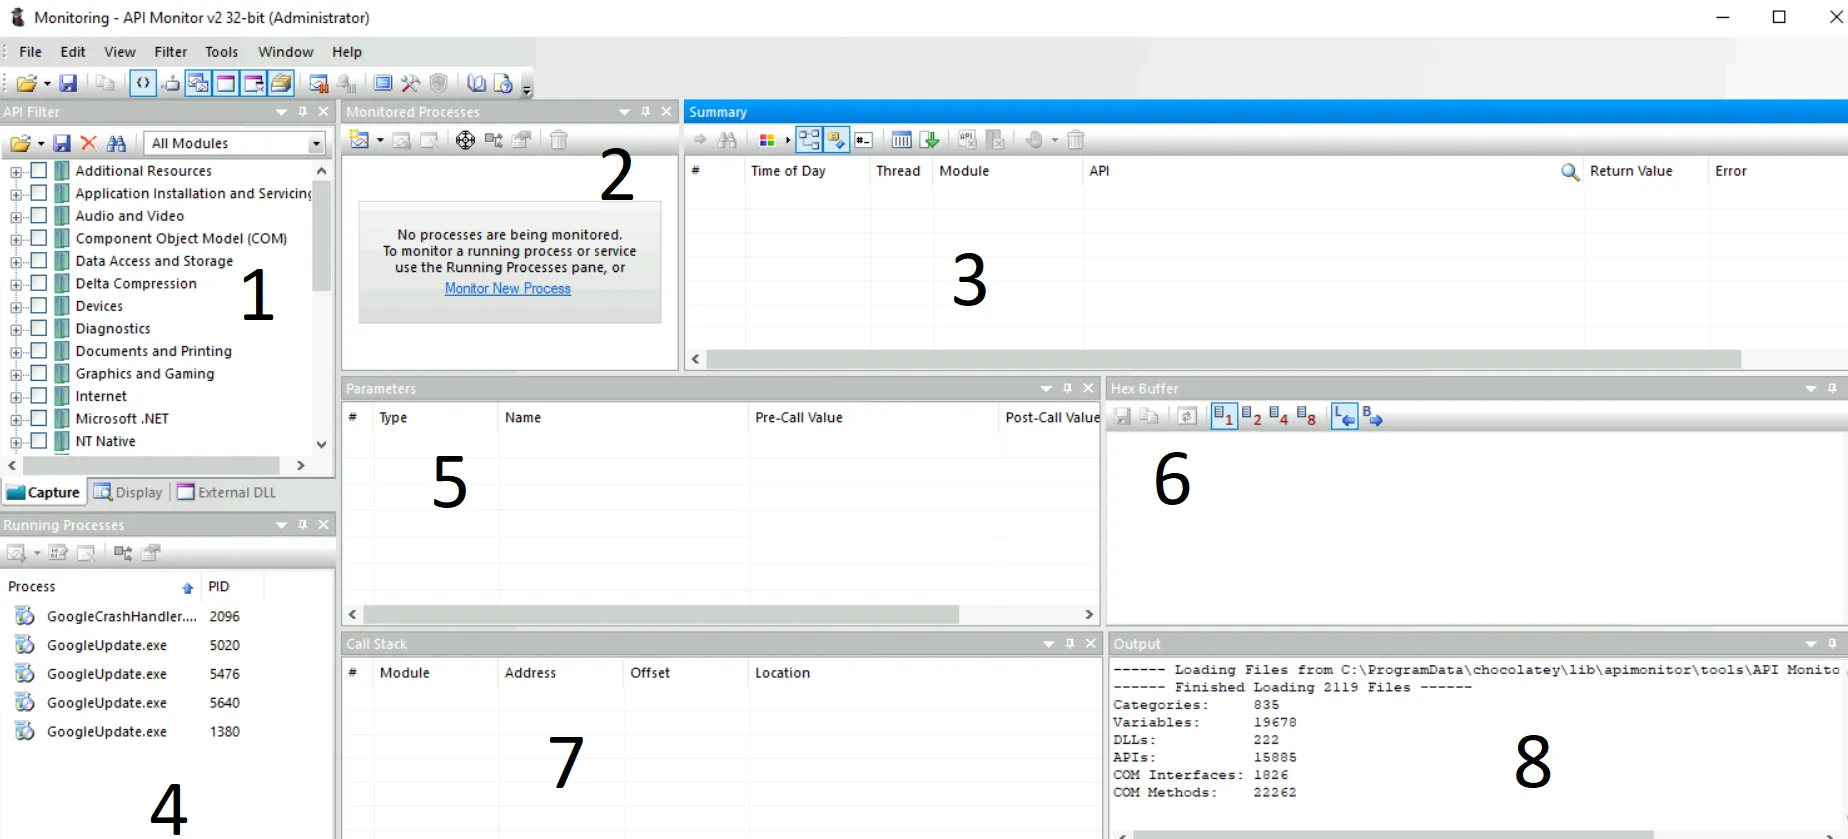
Advanced tool for monitoring API calls made by a process, providing detailed insights into malware behavior. Tracks API calls to identify malicious activities, offering more detailed information than API Logger.
Interface:
-
API Filter Tab:
Filters APIs by group (e.g., ‘Graphics and Gaming’, ‘Internet’). Only APIs from the selected group are displayed.
-
Monitored Processes Tab:
Lists processes currently monitored for API calls. Option: Monitor New Process to start tracking a new process.
-
API Calls Tab:
Displays details of API calls, including: API name, Module, Thread, Time, Return Value, Errors. Primary tab for observing API activity.
-
Running Processes Tab:
Shows all running processes available for monitoring.
-
Parameters Tab:
Lists parameters of the selected API call. Shows parameter values before and after the API call.
-
Hex Buffer Tab:
Displays the hexadecimal buffer of the selected parameter value.
-
Call Stack Tab:
Shows the call stack of the process for the selected API call.
-
Output Tab:
Displays additional output or logs related to the monitoring process.
https://www.youtube.com/watch?v=IjIfu1y1EdQ
Process Explorer:
Part of Sysinternals Suite: A powerful tool, more advanced than Windows Task Manager. Analyzes running processes, identifies malicious techniques like process hollowing and process masquerading.
Interface:
Main View: Displays all running processes in a tree format. Columns: Process Name, CPU Utilization, Memory Usage, Process ID (PID), Description, Company Name.
Lower Pane: Enable via View > Show Lower Pane. Shows detailed information for a selected process, including: Handles: Resources used (Sections, Processes, Threads, Files, Mutexes, Semaphores). DLLs: Loaded dynamic-link libraries. Threads: Active threads within the process.
Process Properties: Right-click a process in the tree and select Properties.
Tabs:
Image Tab: Shows details about the process executable (e.g., path, company). Verify Button: Checks if the executable is digitally signed by the expected organization (e.g., Microsoft for Windows binaries).
Strings Tab: Displays strings in the process’s Image (disk) or Memory. Used to detect process hollowing.
Process Masquerading:
Malware uses process names mimicking legitimate Windows processes or common software to evade detection.
Detection: In the Image Tab of process properties, click Verify to check the digital signature. Limitation: Verification only checks the disk image. A hollowed process (with malicious code in memory) may still show a valid signature.
Process Hollowing:
Malware hollows a legitimate process by replacing its memory code with malicious code while retaining the legitimate process’s appearance.
Detection: in the Strings Tab of process properties: Image Option: Shows strings from the process’s disk image. Memory Option: Shows strings from the process’s memory. Normal Case: Strings in Image and Memory match. Hollowing Indicator: Strings in Image and Memory differs a lot.
Regshot:
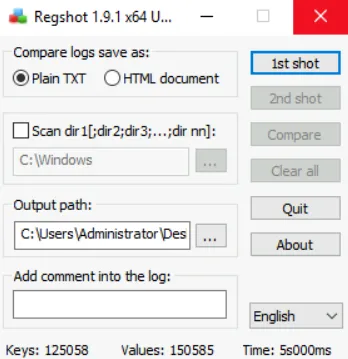
Identifies changes to the Windows registry (and optionally file system) caused by malware during dynamic analysis. Takes snapshots of the registry before and after malware execution, then compares them to highlight changes (added, deleted, or modified keys/values). Does not need to run during malware execution, evading detection by malware that checks for running analysis tools.
Interface:
- Simple interface with options for registry and file system scanning. Scan dir1: Optional setting to monitor file system changes (disabled in this guide for brevity). Output Path: Specifies where comparison results are saved
- Click 1st Shot to capture the registry’s initial state. Options: Take a shot or take a shot and save. Post-shot interface shows details of the first snapshot.
- After the 1st shot, execute the malware in the VM. Wait until the malware completes its malicious activities.
- Click 2nd Shot to capture the registry state after malware execution. Interface displays options for taking the second shot.
- Click Compare to analyze differences between the 1st and 2nd shots. Summary Output: Lists Keys and Values added, deleted, or modified. File and folder changes (if Scan dir1 enabled). Example: Zero file/folder changes if Scan dir1 is disabled.
Malware Evasion
Evasion of Static Analysis:
- Changing the Hash: Every file has a unique hash; slight changes (e.g., adding a NOP instruction) alter the hash. Defeats hash-based detection (except for fuzzy hashes like Context-Triggered Piecewise Hashes).
- Defeating AV Signatures: Anti-virus relies on static patterns; malware authors modify these patterns. Often combined with general code obfuscation to evade signature-based detection.
- Obfuscation of Strings: Strings (e.g., URLs, C2 domains) are encoded and decoded at runtime. Static analysis reveals no useful strings, protecting infrastructure from detection.
- Runtime Loading of DLLs: Malware uses LoadLibrary or LoadLibraryEx to load DLLs at runtime. PE header analysis during static analysis misses dynamically loaded functions.
- Packing and Obfuscation: Packers wrap malware in a layer that decodes at runtime. Static analysis cannot reveal the malicious code inside; unpacking occurs during execution.
Evasion of Basic Dynamic Analysis:
- Identification of VMs: Malware checks for VM indicators (e.g., registry keys, device drivers for VirtualBox). Limited resources (e.g., single CPU, low RAM) may suggest a VM. If detected, malware takes a benign execution path.
- Timing Attacks: Malware uses Sleep to outlast automated analysis systems. Analysis systems may shut down after a few minutes, missing malicious activity. Malware counters mitigation (e.g., shortened sleep) by checking execution time discrepancies.
- Traces of User Activity: Malware looks for user activity (e.g., mouse/keyboard movement, browser history, recent files, system uptime). Minimal activity suggests a controlled environment, prompting a benign execution path.
- Identification of Analysis Tools: Malware queries running processes using Process32First, Process32Next, etc. Detection of tools like ProcMon, ProcExp, or OllyDbg triggers benign behavior. Also checks open window names for analysis tools.
Debugging:
Debugging is the process of identifying and fixing bugs in a program, widely used by software developers. Malware can be seen as a program with “bugs” (evasion techniques) that prevent it from revealing its malicious behavior. Debugging removes roadblocks to uncover malicious activity, essential for advanced malware reverse engineering. Debugger Capabilities: Monitor a running program closely (registers, variables, memory regions per instruction). Modify variable values to control program flow and execution path at runtime.
Types of Debuggers
Source-Level Debuggers:
Work at the source code level. Commonly used by software developers to debug code during development.
Characteristics: High-level debugging, showing local variables and their values. Not typically used in malware analysis due to lack of source code.
Assembly-Level Debuggers:
Debug compiled binaries at the assembly level. Most common for malware reverse engineering, as malware source code is unavailable.
Characteristics: Displays CPU register values and the debuggee’s memory. Attaches to the program, allowing execution control per the analyst’s instructions. Ideal for analyzing compiled malware binaries.
Kernel-Level Debuggers:
Debug at the kernel level, a lower level than assembly. Used for debugging kernel-level code or rootkits.
Characteristics: Typically requires two systems: one for debugging, another running the code. Breakpoints at the kernel level halt the entire system, necessitating a separate debugging system.
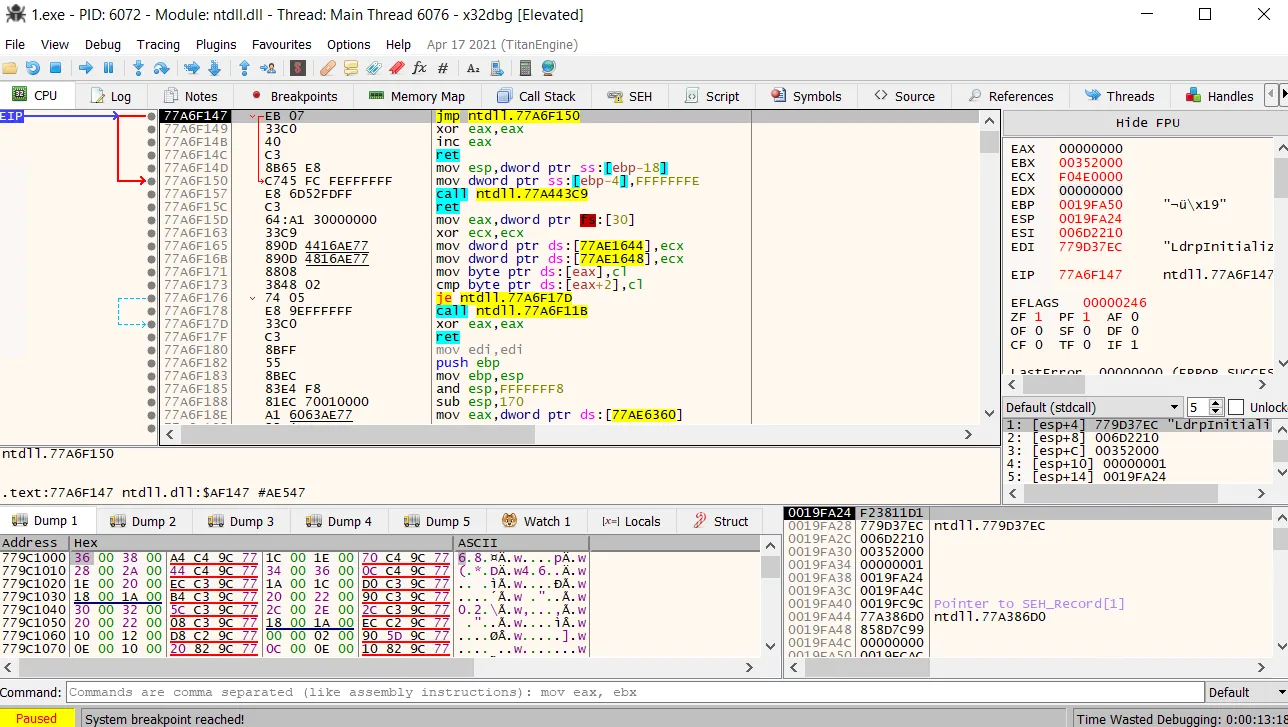
x32dbg/x64dbg Debugger:
Debugger Interface Overview (CPU Tab):
Disassembly Pane (middle): Shows the program’s assembly instructions. Instruction Pointer (EIP) points to the next instruction to execute.
Registers Pane (right): Displays current register values (e.g., EIP matches the address in the disassembly pane).
Stack View (bottom right): Shows the program’s stack contents.
Dump View (bottom left): Displays memory contents.
Timer (bottom right): Tracks time spent debugging.
Tabs:
Breakpoints Tab:
Lists active breakpoints, which pause execution for analysis of registers/memory. Set a breakpoint by clicking the dot next to an instruction in the CPU tab.
Memory Map Tab:
Displays the program’s memory layout.
Call Stack Tab:
Shows the call stack, tracking function calls.
Threads Tab:
Lists running threads in the program.
Handles Tab:
Shows handles to files, processes, or other resources accessed by the process.
Controlling Execution
Key Features (highlighted in the interface):
- Open a new file: Load a different sample.
- Restart execution: Reset the program to the start.
- Stop execution: Terminate the program.
- Execute (arrow key): Run the program until paused/stopped (avoid overuse to prevent freezing).
- Pause: Halt execution manually.
- Step Into: Execute one instruction and enter function calls.
- Step Over: Execute one instruction, skipping function calls.
Patching Malware
Scenario: At a conditional jump instruction (JNE), the jump is not taken due to the Zero Flag (ZF) being set. Previous analysis showed ZF as the reason for the jump not being taken.
Runtime Manipulation: Double-click ZF in the registers pane to toggle it from 1 to 0. Result: Jump is now taken, redirecting execution to address D116E, bypassing the evasion path. Limitation: This change is temporary and resets on re-execution unless the binary is modified.
Patching the Binary:
Goal: Permanently alter the binary (“defang”) to ensure the evasion path is avoided during dynamic analysis, even when run by double-clicking. Process: Modify the binary’s instructions to force the desired execution path, then save the changes to disk.
Patching Options
Fill with NOPs: Right-click the instruction at D1169 and select Binary > Fill with NOPs. Replaces the instruction with NOP (no-operation) instructions, which do nothing.
Details: The original instruction’s size (e.g., 5 bytes) is filled with multiple NOPs (each 1 byte). Example: One instruction replaced with five NOPs to match the size. Use Case: Neutralizes the instruction, potentially skipping unwanted behavior (e.g., a call leading to evasion).
Saving the Patched Binary
Go to File > Patch File to save changes. A window displays the modified instructions (e.g., NOPs replacing the original instruction). Select a location to save the patched file. Result: The patched binary (crackme-arebel1.exe) no longer follows the evasion path when executed.